What is Value Stream Mapping?
Value stream mapping is a lean-management tool or flowchart method used to illustrate and analyze the current state of a product or service in order to improve the steps required to deliver it as well as reduce waste. It utilises a set of standard symbols that represent various work activities and information flows.
Value Stream Mapping Benefits & Purpose
A Value Stream Map creates a visual representation of the flow of an item through a process and helps you see the source of waste. It provides a common language for describing processes while helping you avoid “cherry picking” lean concepts and techniques. It becomes the blueprint for lean implementation and shows the linkage between information flow and the physical flow of the patient or item.
Above all, it helps visualize the current and future states.
1. Value Stream Mapping is a powerful tool for analyzing information and flow throughout or between organizations in order to identify and plan improvements.
2. A VSM provides clarity to reduce inventory and lead time, as well as helps to plan and identify lean rapid improvement events to increase effectiveness.
3. VSM allows participants from different parts of an organization to gain an understanding of overall information and material flow.
4. Making breakthrough improvements requires out-of-the-box, cross-functional thinking. You must be able to see the waste across the entire flow of work to gain clarity to eliminate it.
5. A VSM is a tool to help you visualize your current state in order to realize the future state.
The exercise of completing a Value Stream Map reveals waste, and sources of waste, that you probably wouldn’t notice on a day to day basis.
What is a Value Stream?
A value stream consists of all of the activities within an organization which must be completed to generate a service or product. Any process involving a patient or customer is a value stream.
Understanding the value stream allows one to see value-added steps, non-value added but needed steps, and non-value-added steps. Value-added activities transform or shape material or information into something that meets customer requirements.
Why is it called a value stream?
Value assumes that you are creating something worthwhile that a customer is willing to pay for, or something that contributes to the output of a process in a meaningful way.
Stream refers to a sequential flow of activities needed to deliver work units to a customer or to complete a process.
What is a Value Stream Map?
A Value Stream Map (VSM) is a particular style of a process map that shows all of the process steps required to complete a service or produces an output. It is a visual diagram of an entire process which allows you to see the whole picture—the information, products, and people that flow through a process. A Value Stream Map shows all of the tasks currently required to move a product or process from inputs (from suppliers) to outputs (to customers). Value stream mapping provides a common vocabulary to talk about improving patient care or process flow and is a great tool to use in problem-solving.
Value Stream Map Example
What Information Does a Value Stream Map Show?
A value stream map summarizes, on one page, a tremendous amount of information about a process.
Your map may include:
- The flow of the process from beginning to end
- Information flow
- Time data—cycle time, lead time, wait time
- Inventory build-up of people or things
- First time quality
- Staffing data
Healthcare Value Stream Mapping
The goal of value stream mapping in healthcare is to optimize the patient journey, or processes that support the patient journey. This means making the treatment of patients more effective, timely, cost-efficient and high-quality.
The focus of mapping is to improve processes that support caregivers and employees by distinguishing process steps which create value from those which don’t (rework, wait times, etc.), and build in quality by eliminating waste.
The results are processes that create the most value for patients and customers but consume the fewest resources.
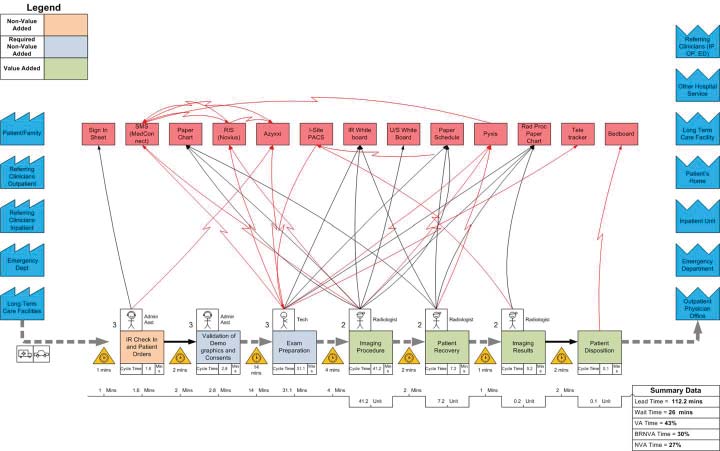
The following example shows a Value Stream Map of Interventional Radiology Patients.
Value Stream Mapping Steps
Step 1: Select and schedule the VSM team to include:
- Subject matter experts who understand the process
- A Lean Expert to facilitate the mapping
- Fresh eyes to question the status quo and bring a new perspective
- The customer and suppliers, if possible, but at a minimum bring your VOC – CTQ data
Step 2: Secure a room near the process area and gather the following supplies:
- Butcher paper
- Post-its
- Markers
- Pencils
- Data collected in advance
Step 3: Gather as much data as possible before you start. You will verify the accuracy of any pre-existing data in the VSM process. Look for information on:
- Cycle time (C/T): The time it takes to complete all work elements before repeating them. For example: how long to triage a patient in the ED.
- Value-added time (VAT): The time of work elements that actually transform the product (patient) in a way the customer is willing to pay for. For example, the time to takes to measure the patient’s vital signs as part of triage.
- Lead time (L/T): The time it takes one piece (patient) to move all the way through a process or a value stream from start to finish. For example, the time from patient arrival until the patient is discharged from the ED.
- Work descriptions: Documented standard definitions or explanations of job roles and responsibilities.
- Number of workers: The total number of specific employees scheduled for a given shift or time block.
- Total working time per day (all shifts): Total number of available hours to be worked/scheduled in a day. Some departments such as the OR may only operate 13 hours from 6am – 7pm, whereas an ED will operate 24 hours.
- Demand: Measure and stratify demand for products or services by type, time of day, and day of week. For example, the arrival pattern of ED patients by track, by time of day, by day of week.
- Capacity: Estimate both scheduled and theoretical capacity. Pay special attention to potential constraints and bottlenecks in the process.
- Quantity of work performed: The total number of measurable work or units, performed for a given period of time, for example, total medication orders requested for each shift.
- Waiting or delay time: Total time spent waiting for an activity to be performed due to bottle necks in the process or other causes of delay.
- First pass yield: The percentage of time the customers need would be met the first time with no rework. Final yield is what a customer actually experiences, including rework.
Step 4: Take a quick walk through the entire end-to-end value stream.
- Instead of starting at the beginning of the process, start at the end of the process and walk upstream. This way you will start with the processes that are linked most directly to the customer.
Step 5: Begin drawing the map with the VSM team.
- Start with the internal and external customer on the left and right hand sides of the page.
- Add the beginning and ending points of the process. Your process will begin on the left and end on the right side of the page.
- Add process steps in between, remembering to focus on how things really are, not how they should be.
- Document the flow of information. Usually this is done with red zigzag lines.
- Add push-pull arrows showing the patient moving from step to step.
- Add a data box below each process step.
Step 6: Validate the Map. Go to the actual process area, observe the process, talk to staff, and then update your map with what you have learned.
- In the team room, complete as much of the map as possible.
- Take the team to the actual process area.
- Observe the process and talk to employees.
- Note any discrepancies between what the team documented and what was actually observed or described by employees.
- Use a stopwatch to manually collect time data if needed.
- Return to the team room, discuss observations, and update the map.
Kaizen Bursts
At this point in the development of the Value Stream Map, it is an ideal time to identify known issues within the process and visually document them with what are called Kaizen bursts. Make sure the bursts stand out and draw attention to where issues exist. If using post-its, bright fluorescent colors work, or if using an electronic program, highlight the bursts in bright yellow.

Value Stream Mapping Symbols
Symbols on a value stream map fall into the following categories: process, materials, information and general. When building your value stream map – here are a few symbols you can use below:
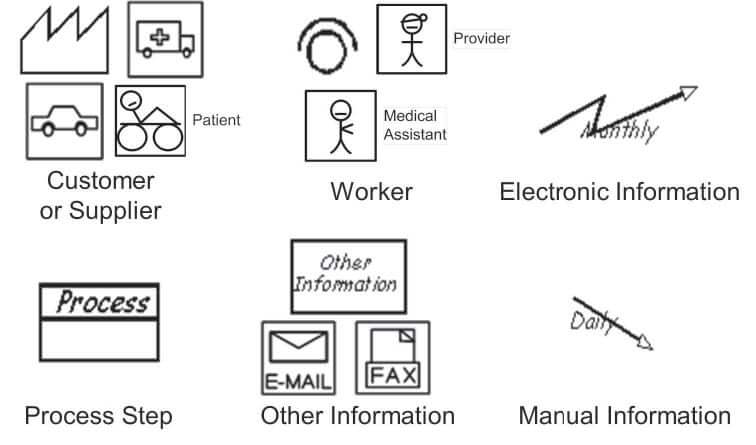
- Customer or Supplier: The Customer/Supplier symbol represents the customer in the upper right of the value stream map or the supplier in the upper left. In healthcare, it is very common for patients and providers to be included as both the customers and suppliers in the value stream.
- Worker: The Worker symbol represents people doing various jobs/tasks. Some icons use stick figures while others can be a view from the top down; imagine that you are looking at the top of the workers head from the ceiling.
- Electronic Information: The Electronic Information symbol depicts and includes EDI (electronic data interchange), WANS (wide area network), the internet, intranets or LANS (local area networks.) Remember that the value stream should also depict information flow. You will typically label the different IS systems and vendors using a rectangular box at the top of the map.
- Manual Information: The Manual Information symbol depicts the information flow regarding conversations, memos, emails, phone calls etc.
- Process Step: A general rule of thumb is that a process box indicates a process in which the item (patient) is flowing. Drawing one box for every single processing step would make the map unwieldy.
- Other Information: Information is passed in many different forms such as verbal communication through phones or electronic communication devices, text messages, email or fax. All of these modes can be represented by a unique symbol.
- Data Boxes: These are placed under the supplier and customer icons to document requirements. Data boxes are placed under the process box to record relevant process metrics.
- Value Decomposition Timeline: This allows you to compare the value added times or the processing times to total lead times.
- Pull or Trigger: This is a process box or resource that, when available, triggers a signal to upstream processes to produce to feed the available capacity. For example, a scheduled discharge is a trigger which signals the ED that a bed will soon be available for new admission.
- Inventory or Waiting: In healthcare, people are often inventoried so that providers or expensive capital assets are fully utilized.
- Push vs. Pull Arrows: Push production is signified by a striped arrow. Pull production is signified by a solid arrow.
- Database: This may be either manual (paper) or electronic and symbolizes where information is stored in the process.
Tips for Creating a Value Stream Map
- Even if you plan on putting your map in a software program such as eVSM, iGrafx or Visio, start off with low-tech tools such as butcher paper and post-its.
- Move, eliminate, or add post-its as the team learns about the process.
- This method allows for greater team interaction.
- As you are mapping, don’t get hung up on discussing solutions or what must be fixed in the process. You will get to this after you do the analysis on your Current State Map. However, you don’t want to forget good ideas that come up, so nominate someone to document the ideas, and move on with the mapping.
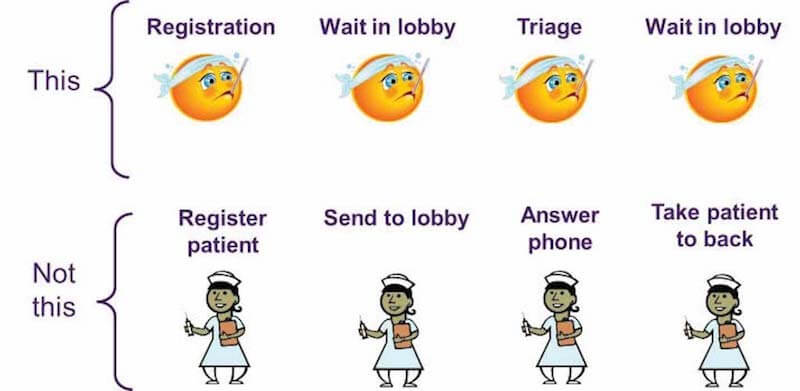
Pitfalls & Caveats of Value Stream Mapping
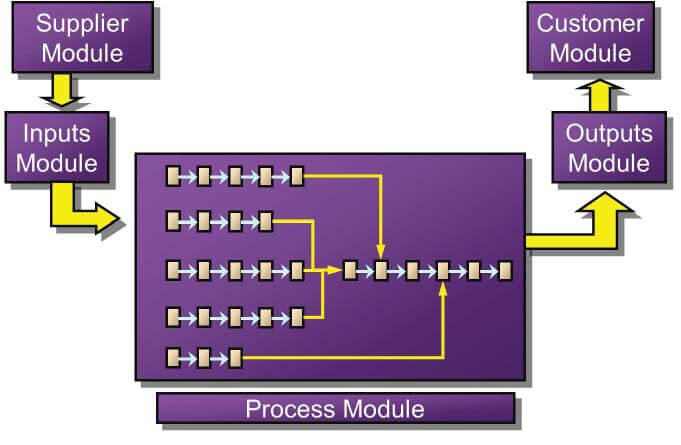
One common pitfall in value stream mapping is to forget that you are following the “thing moving through the process,” not staff members. Whether the thing is a patient, a medication, or an invoice, always document from the perspective of that thing. Remember, the value stream map is not the same as a process map. The image below shows that you should stay focused on the “item” going through the process, not the people or machines working in the process.
For more information on value stream mapping and how Juran can help you leverage it to improve business quality and productivity, please get in touch with the team.
| Check out Juran’s LSS Training Courses |
| Lean Six Sigma Yellow Belt |
| Lean Six Sigma Green Belt |
| Lean Six Sigma Black Belt |
| Upgrade to Black Belt |
| Lean Six Sigma Master Black Belt |
| Lean Expert Program |