Total Productive Maintenance (TPM) is a set of strategic business initiatives intended to maintain and improve the integrity of quality, production and safety by taking a holistic approach to the relationship between workers and machinery.
In simpler terms: the best people to know how machines are running are the people operating those machines. If someone operating a machine identifies or suspects that something is amiss – either as a result of routine maintenance or because they notice a change in how the machine is working – they can raise the issue and ensure proactive corrective action is taken before operational efficiency, quality of goods produced or the safety of the workforce are impacted.
Rather than treating machine operation and machine maintenance as distinct tasks carried out by two different sets of people, TPM places an emphasis on empowering workers to be responsible for, and to help maintain, their own equipment. Specialists will still be needed, but only when something is outside the remit of everyday maintenance.
TPM is based on a foundation known as 5S and supported by 8 pillars of activity.
5S Methodology
The foundation of TPM comprises a set of principles known as 5S. When properly implemented, 5S methodology creates a safe, clean, organized and efficient workplace. This will reduce waste, increase productivity and improve quality. The five stages of 5S are as follows:
- Sort: separate the essential items from the non-essential and remove anything that is not needed from the work area.
- Straighten: organize the remaining essential materials, ensuring there is a place for everything and everything is in its correct place.
- Shine: clean and inspect the work area, including all equipment. Dirty equipment can lead to equipment failure, which can result in lost time.
- Standardize: establish a system and standards to facilitate the first three Ss and help make 5S a habit. This is regarded by some as the most important stage in 5S methodology.
- Sustain: make sure the system and standards are routinely applied to ensure a safe working environment. This will require regular audits and the implementation of improvements, with the goal of ingraining the 5S process into organizational culture.
The 5S Principles are a powerful tool for reducing waste and boosting efficiency. It’s important that they are acknowledged as a key element of a continuous improvement initiative rather than an end in themselves. The most benefit is enjoyed when they become an integral part of business culture, with the methodology adopted by each part of an organization.
8 Pillars of Total Productive Maintenance
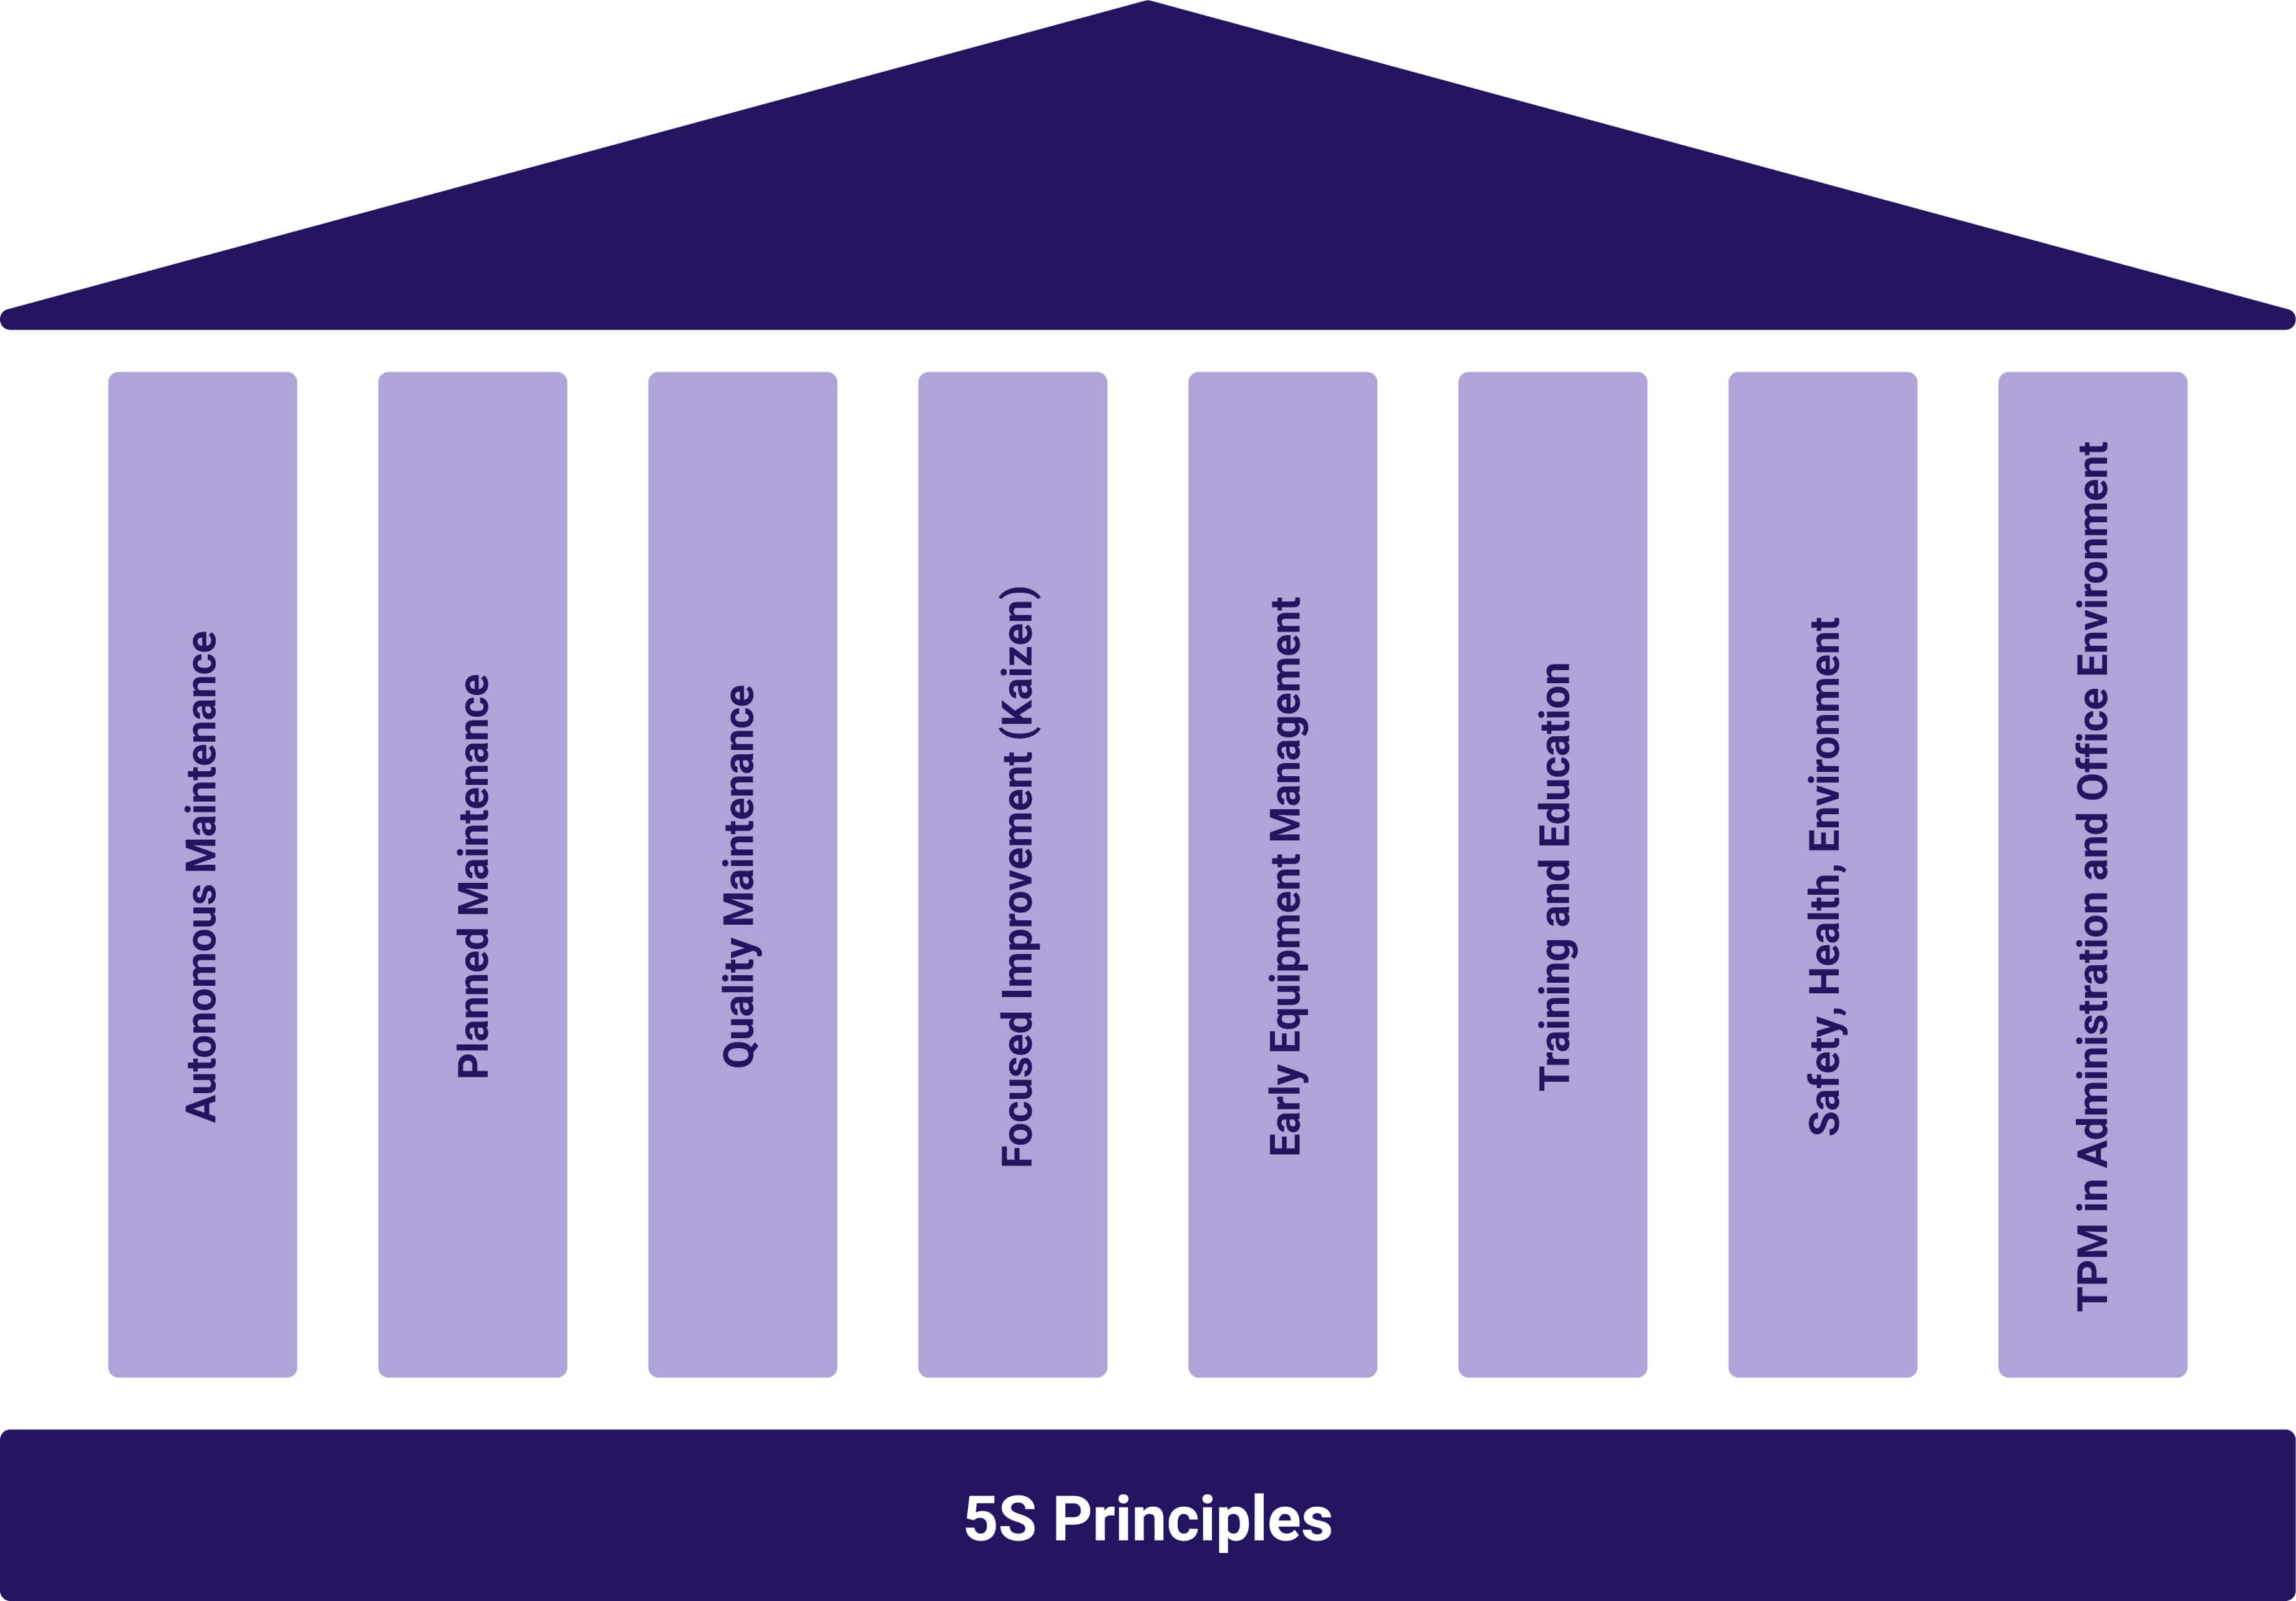 The 8 Pillars of Total Productive Maintenance largely focus on proactive and preventative techniques intended to improve the reliability of machinery and equipment. They are:
Autonomous Maintenance
Routine maintenance – e.g. cleaning, lubricating – is the responsibility of the operator. This increases the knowledge, skills and sense of ownership of the operator and ensures the machine is well-maintained. It also catches potential problems before they arise and frees up specialist maintenance staff for other activities.
Planned Maintenance
This is scheduled maintenance activity. It extends the life of a machine, can be planned to cause the least disruption, and also is intended to avoid unplanned downtime.
Quality Maintenance
This aims to make the detection and prevention of errors an integral element of the production process. The focus is on removing the root cause of defects, reducing both the overall number that occur and the associated costs.
Focused Improvement (Kaizen)
Kaizen is a system of continuous improvement based on the principle that small groups of cross-functional workers will collaborate to produce regular incremental improvements to the production process. The aim is to identify and resolve recurring problems, using the broad vision that a cross-functional team can bring to the process, with the intention of establishing a culture of continuous improvement.
Early Equipment Management
This leverages existing knowledge and understanding of current machines to design better, new machines. The aim is to build machines that are more robust, can reach optimum output capacity faster and require minimum maintenance.
Training and Education
This is intended to identify and bridge gaps in knowledge, skills and abilities so that all staff are highly and appropriately trained. This ensures that everyone, whether operators, maintenance personnel or management, works at the optimum level and with full knowledge of the goals of TPM.
Safety, Health, Environment
The aim is to establish and maintain a safe and healthy workplace. This works towards the ultimate goal of an accident-free work environment by eliminating risks and hazards.
TPM in Administration and Office Environment
The aim here is to see that TPM principles and techniques are applied to administrative functions. This is intended to ensure that the principle of eliminating waste is adopted throughout the business, which in turn will result in improved administrative operations – e.g. procurement and order processing.
Overall Equipment Effectiveness
Overall Equipment Effectiveness – OEE – is a measure that indicates the overall health, or effectiveness, of a process or machine. It is based on availability, performance and output quality, and the resulting OEE score is expressed as a percentage.
How does it relate to Total Productive Maintenance?
OEE is intended to underpin TPM initiatives by accurately tracking progress towards achieving “perfect production” – no defects, optimum operation, no stop time. It represents the main KPI (key performance indicator) of a TPM program.
What are the scores and what do they mean?
OEE calculations are performed using data from the Six Big Losses of machines and processes, as outlined below. They show the percentage of planned production time that really is productive.
OEE scores aim to measure availability, performance and quality. They can show, for example, how productive a machine, an operator, or a production line has been, and the quality level of output achieved, as measured against the optimum level of activity.
While OEE scores allow different versions of the same process within an organization to be compared, the performance of different organizations may also be compared. Below, we show benchmark scores against which the performance of an organization may be measured.
Benefits of OEE Tracking
Tracking OEE can confer a range of benefits; here are six key outcomes:
- OEE scores can provide a focus for improvement and continuous improvement initiatives.
- They make it easy to visualize performance based on hard data, rather than relying on instinct.
- They help you to achieve maximum return on investment in machinery, by ensuring each machine operates to its optimum level of efficiency and effectiveness.
- They help you to be competitive, as you can take steps to increase production based on available capacity.
- They help you to maximize the efficiency of the workforce, by optimizing changeover and set-up times, and directing resources where they are needed.
- They help manage the Six Big Losses by helping you to understand and therefore reduce the costs of availability loss, performance loss and quality loss in terms of stop time and defects.
The Goals of OEE
In essence, there are three goals attached to OEE, those being:
- Benchmark current performance
- Take steps to improve on that performance
- Ensure that improvement is maintained
Once you get past that initial set of broad-based goals, more specific goals can be set depending on the nature of the individual business and the manufacturing process employed. Let’s look at some options.
Asset or Work Unit OEE
Measuring OEE on an individual machine is fairly straightforward and can be used to determine best operator, best product for that machine to produce and best time of day for it to run.
Work Cell OEE
If a work cell has a number of components operated by an individual or a crew, measuring the OEE can help change behavior/working practice to obtain a better result.
Production Line OEE
OEE can be used to identify bottlenecks or other hold-ups in a production process. Changes should be aimed at ensuring the most valuable or critical asset is always in operation, and the line should be designed around this requirement.
Product OEE
Assuming a product is manufactured on more than one machine or line, the ability to compare the various OEE scores and identify why the best is the best can help drive big improvements.
OEE Challenges
When it comes to OEE, it’s not enough just to collate data – the information needs to be used to drive change and a process of improvement, otherwise it becomes nothing more than a tick-box exercise.
In order to get the most out of it, three things need to be able to be achieved. First, you need to be able to collect the data and be confident it is accurate. Second, it must be possible to collect that data cost-effectively. Finally, the organization needs to have a culture of continuous improvement, to ensure that the data is used to achieve constructive change.
Provided these three things can be achieved, OEE can underpin a dynamic program of continuous and sustainable improvement.
Calculating OEE
An OEE calculation is based on the performance data generated by the Six Big Losses (see below). There are three main areas that are taken into account: availability; performance; and quality.
Benchmarks
OEE benchmark scores are:
- 100%: perfect production – no defects, optimum operation, no stop time.
- 85%: world-class result for individual manufacturers – a good long-term goal.
- 60%: fairly typical for individual manufacturers – indicates room for improvement.
- 40%: low, but not uncommon for manufacturers at the start of their TPM and/or lean program journeys.
Calculations
OEE calculations may be conducted as follows:
Availability Loss
We can calculate availability loss based on the availability of a worker to operate the machine. In some instances, where shifts are worked, that can be up to 24 hours per day. For the sake of simplicity, we’re going to assume a single worker employed for an 8-hour shift operates the machine.
That gives 8 hours x 60 minutes = 480 minutes of available time. From this we would deduct any time allowed for set-up, warm-up, or perhaps planned maintenance – let’s assume 20 minutes in total, so 460 minutes of time is available. Now let’s throw in a raw materials jam, resulting in 40 minutes of unplanned maintenance to get the machine operational again.
Time worked ÷ Time available = OEE
(460 – 40) ÷ 460= 0.913, or 91%
Performance Loss
Again, our starting point is the 460 minutes of operator availability. Let’s say that the optimum rate of production for the machine is two minutes, meaning that for a 100% OEE score, 230 products or components would have to be produced. Now let’s assume that during the shift, just 190 products were produced.
Actual number of products ÷ Optimum number of products = OEE
190 ÷ 230 = 0.826, or 83%
Quality Loss
When it comes to quality loss, the calculation is based on the actual number of useable products produced, not the optimum, so let’s say out of the 190, 25 were unacceptable.
Number of good products ÷ Total number of products = OEE
165 ÷ 190= 0.868, or 87%
Final OEE Calculation
Those figures combine to give an overall OEE score, as follows:
Availability x Performance x Quality = OEE
0.91 x 0.83 x 0.87 = 0.657, or 66%
It is this that would be measured against the benchmark scores, indicating that room for improvement exists in this organization.
Six Big Losses
The Six Big Losses don’t just encompass machine breakdowns, they also incorporate the quality of the product produced and the efficiency of operation. As we have seen, OEE can be calculated from this data and so an overall picture of the efficiency of each machine can be gained. That allows improvement activity to be focused where it is needed most.
Equipment Failure and Unplanned Stops (Availability Loss)
Significant periods of time during which equipment scheduled to be operating is not running. Causes include breakdown, tool failure, unplanned maintenance.
Setup and Adjustments (Availability Loss)
Significant periods of time during which equipment that should be operating is not running. Causes include warm-up time, tooling adjustments, changeovers, lack of resources (e.g. operators, raw materials). Planned maintenance also falls into this category.
Idling and Minor or Slow Stoppages (Performance Loss)
Equipment stops for a short period of time (typically a few minutes) and the issue is resolved by the operator. Causes include material jams, misfeeds, incorrect settings, blocked sensors.
Reduced Speed and Slow Running (Performance Loss)
Equipment is running at lower than its ideal speed. Causes include incorrect settings, alignment issues, inexperienced operator, poor lubrication.
Quality and Production Defects (Quality Loss)
Defective parts are produced during stable running of machines. Causes include incorrect settings, operator error.
Reduced Yield (Quality Loss)
Defective parts are produced from machine start-up to steady running (e.g. during the warm-up phase). Causes include the need for the machine to complete a warm-up cycle, incorrect settings, poor changeover practice.
By employing TPM methodology in your organization, you should feel the benefit of smoother production, reduced waste, and better quality products, ultimately resulting in improved customer satisfaction and financial performance.
Browse our Knowledge Base for further insights on improving your business processes and creating a culture of continuous improvement.