What is a Statistical Control Chart?
A statistical control chart compares process performance data to computed “statistical control limits,” drawn as limit lines on the chart. The process performance data usually consist of groups of measurements (rational subgroups) from the regular sequence of production while preserving the order of the data.
A prime objective of a control chart is detecting special (or assignable) causes of variation in a process—by analyzing data from both the past and the future. Knowing the meaning of “special causes” is essential to understanding the control chart concept.
Process variations have two kinds of causes: (1) common (or random or chance), which are inherent in the process, and (2) special (or assignable), which cause excessive variation. Ideally, only common causes should be present in a process because they represent a stable and predictable process that leads to minimum variation. A process that is operating without special causes of variation is said to be “in a state of statistical control.” The control chart for such a process has all of the data points within the statistical control limits. The object of a control chart is not to achieve a state of statistical control as an end in itself but to reduce variation.
The control chart distinguishes between common and special causes of variation through the choice of control limits (Figure 20.4).
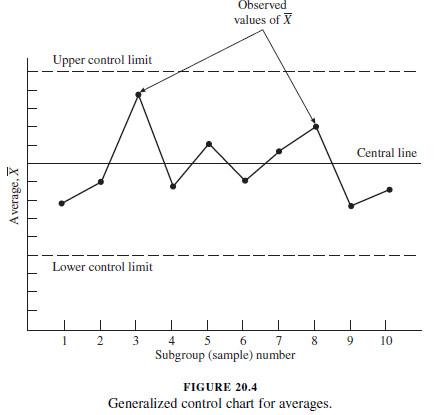
These are calculated by using the laws of probability so that highly improbable causes of variation are presumed to be due to special causes not to random causes. When the variation exceeds the statistical control limits, it is a signal that special causes have entered the process and the process should be investigated to identify these causes of excessive variation.
Random variation within the control limits means that only common (random) causes are present; the amount of variation has stabilized, and minor process adjustments should be avoided. Note that a control chart detects the presence of a special cause but does not find the cause—that task must be handled by a subsequent investigation of the process.
For more information on statistical control charts and how Juran can help you leverage them to improve business quality and productivity, please get in touch with the team.
| Check out Juran’s LSS Training Courses |
| Lean Six Sigma Yellow Belt |
| Lean Six Sigma Green Belt |
| Lean Six Sigma Black Belt |
| Upgrade to Black Belt |
| Lean Six Sigma Master Black Belt |
| Lean Expert Program |