What is a Failure Mode and Effect Analysis (FMEA)?
Failure Mode and Effect Analysis (FMEA), also known as “Potential Failure Modes and Effects Analysis” as well as “Failure Modes, Effects and Criticality Analysis (FMECA)” is a systematic method for identifying possible failures that pose the greatest overall risk for a process, product, or service which could include failures in design, manufacturing or assembly lines. A process analysis tool, it depends on identifying:
- Failure mode: One of the ways in which a product can fail; one of its possible deficiencies or defects
- Effect of failure: The consequences of a particular mode of failure
- Cause of failure: One of the possible causes of an observed mode of failure
- Analysis of the failure mode: Its frequency, severity, and chance of detection
An FMEA can be used when designing or improving a process.
Types of FMEA
There are currently two types of FMEA: Design FMEA (DFMEA) and Process FMEA (PFMEA).
Design FMEA
Design FMEA (DFMEA) is a methodology used to analyze risks associated with a new, updated or modified product design and explores the possibility of product/design malfunctions, reduced product life, and safety and regulatory concerns/effects on the customer derived from:
- Material Properties (Strength, Lubricity, Viscosity, Elasticity, Plasticity, Malleability, Machinability etc.)
- The Geometry of the Product (Shape, Position, Flatness, Parallelism,
- Tolerances/Stack-Ups
- Interfaces with other Components and/or Systems (Physical Attachment/Clearance; Energy Transfers; Material Exchange or Flow i.e Gas/Liquid; Data Exchanges – Commands, Signals, Timings)
- Engineering Noise including User Profile, Environments, Systems Interactions & Degradation
Process FMEA
Process FMEA (PFMEA) is a methodology used to discovers risks associated with process changes including failure that impacts product quality, reduced reliability of the process, customer dissatisfaction, and safety or environmental hazards derived from the 6Ms:
- Man: Human Factors / Human Error
- Methods: Methods involved in processes of product/service including assembly lines, supply chains and communications standards
- Materials: Materials used in the process
- Machinery: Machines utilized to do the work
- Measurement: Measurement systems and impact on acceptance
- Mother Earth: Environment Factors on process performance
When to Use FMEA
You should use a FMEA when:
- A product is having its design updated or is getting a new design (includes new products altogether)
- A service is being transformed with additional, new, modified steps
- A process or a supply chain is being altered, changed and modified
- You are developing new or updated control plans.
- You are creating improvement goals.
- You are analyzing failures of existing processes, products or services.
- There are periodic checks during the life of a product, service or process.
FMEA Benefits
As a tool, Failure Mode and Effect Analysis is one of the most effective low-risk techniques for predicting problems and identifying the most cost-effective solutions for preventing problems. As a procedure, FMEA provides a structured approach for evaluating, tracking and updating design/process developments. It provides a format to link and maintain many company documents. Like a diary, FMEA is started during design/process/service conception and continued throughout the saleable life of the product. It is important to document and assess all changes that occur which affect quality or reliability.
You do not have to create a problem before you can fix it. FMEA is a proactive approach to solving problems before they happen.
When FMEA is done by a team, the payback is realized by identifying potential failures and reducing failure cost because of the collective expertise of the team in understanding how the design/process works. FMEA is highly subjective and requires considerable guesswork on what may and could happen, and means to prevent this. If data is not available, the team may design an experiment, collect data, or simply pool their knowledge of the process.
FMEA Key Concepts
- FMEA provides a structured approach to identifying and prioritizing potential failure modes, taking action to prevent and detect failure modes and making sure mechanisms are in place to ensure ongoing process control.
- FMEA helps to document and identify where in a process lies the source of the failure that impacts a customer’s CTQ’s
Tools Used to Plan and Support FMEA
Many tools and techniques can be used when completing the FMEA form. There can be much analysis conducted to complete the form.
The following list is not a complete list of tools, but a sampling of tools which may be used.
- QbD Planning Worksheets
- Control Chart
- Histogram
- Benchmarking
- Pareto Chart
- Block Diagram
- Selection Matrix
- Cause-Effect Diagram
- Scatter Plot
- Design of Experiments
- Process Flow Diagram
- Statistical Estimation
- Regression/Correlation
- Complexity vs. Impact
- Fault Tree Diagram
- Scalability Analysis
- Value Analysis
- Cost/Benefit Studies
- Product/Process Design Matrix
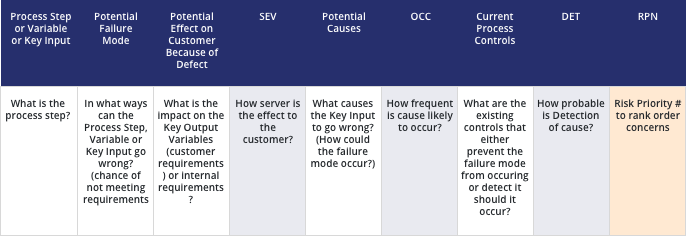
How Does FMEA Work?
Once each failure mode is identified, the data is analyzed, and three factors are quantified:
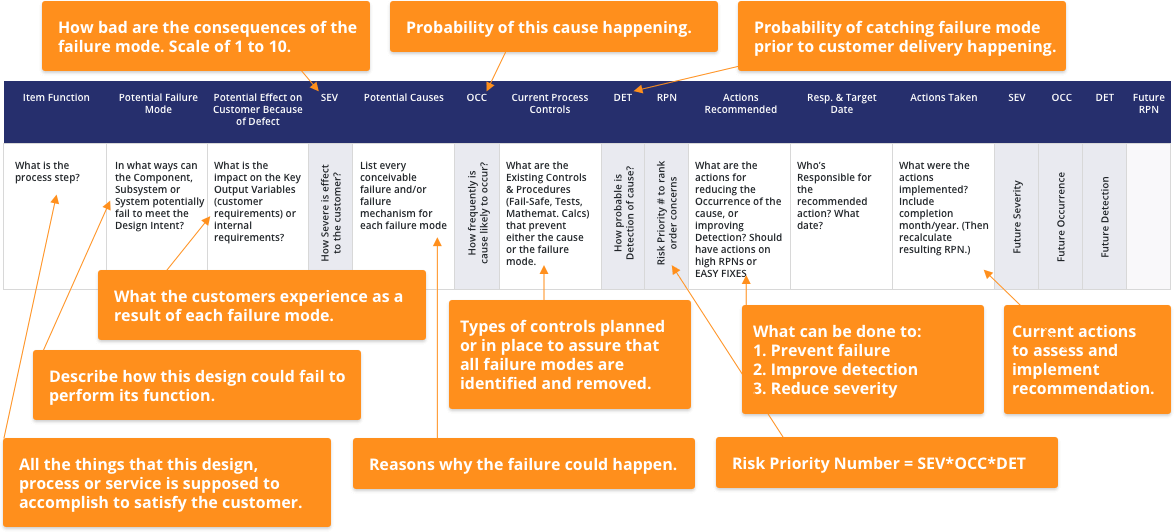
- Severity (SEV): The severity of the effect of the failure as felt by the customer (internal or external). The question may be asked, “How significant is the impact of the effect on the customer?”
- Occurrence (OCC): The frequency which each failure or potential cause of the failure occurs. The question may be asked, “How likely is the cause of the failure mode to occur?”
- Detection (DET): The chance that the failure will be detected before it affects the customer internal or external). The question may be asked, “How likely will the current system detect the failure mode if it occurs, or when the cause is present?”
Each of the three factors is scored on a 1 (Best) to 10 (Worst) scale. The combined impact of these three factors is the Risk Priority Number (RPN). This is the calculation of risk of a particular failure mode and is determined by the following calculation: RPN = SEV x OCC x DET
The RPN is used to place a priority on which items need additional quality planning.
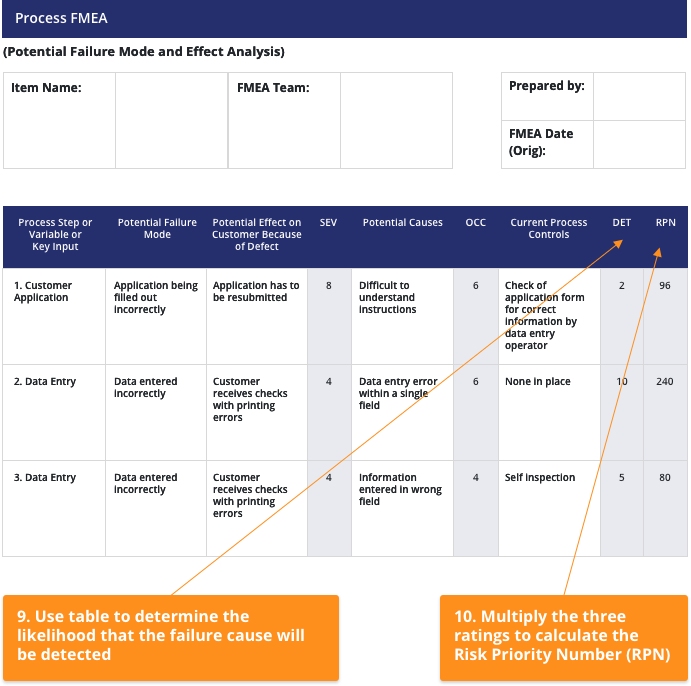
FMEA Process Example
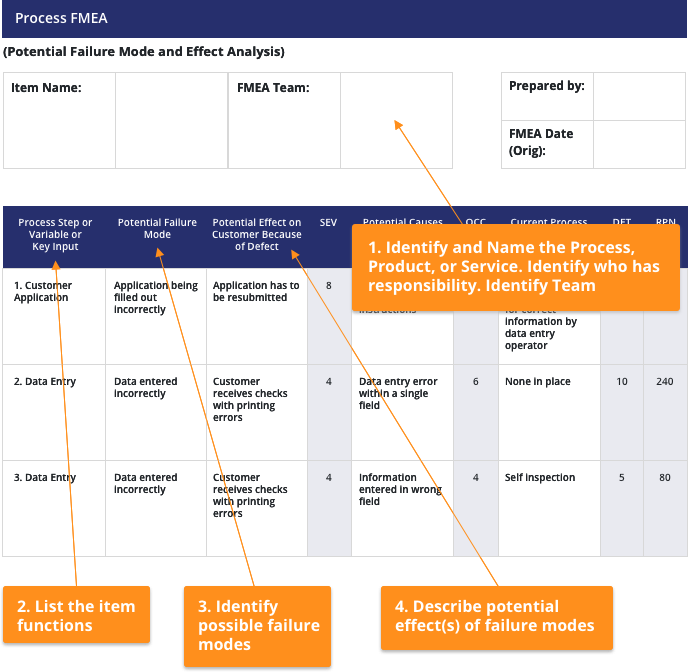
Customer Loan Process
The FMEA in the following example is from a project looking at a commercial loan process. In this process a customer fills out a loan application, the data from the application form is entered into a database, and the customer is sent checks.
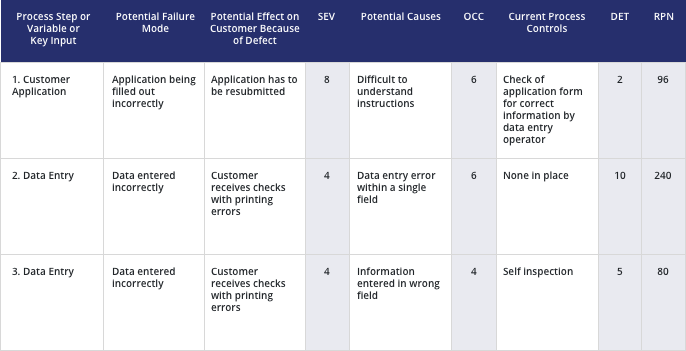
A cross-functional team identified the following failure modes:
- Application filled out incorrectly
- Data entered incorrectly
The potential effect or severity of these failure modes on the customer ranges from 4, for the “data entered incorrectly,” to 8 for the “application filled out incorrectly.”
Note that there are two potential causes for the frequency of occurrence of the potential causes which range from 4 to 6. The ability to detect the potential causes also ranges from 2 to 10. The failure mode “data entered incorrectly” with a potential cause of “data entry error within a single field” has the highest RPN, and warrants further review since it has been identified that there are no controls in place, and a detectability score of 10 has been assigned. The failure mode for “application filled out incorrectly” has a lower RPN of 96, but may also deserve further investigation since the severity rating is high at 8.
Who Should Participate in FMEA?
The important thing to point out is that the FMEA team is a cross-functional team which may include outside parties (key suppliers or key customers). The outside parties need to be selected carefully to avoid potential business confidential agreements.
All FMEA team members must have working-level knowledge of at least some of the relevant design requirements or design specifications associated with your project.
The following list is a sample of who should participate on an FMEA team.
- Research and Development
- Sales
- Finance
- Accounting
- Brokers/Underwriters/Actuaries
- IT
- Clerical Staff
- Maintenance
- Key Customers
- Materials
- Calibration
- Field Service
- Engineering Departments
- Technicians
- Production/Manufacturing
- Packaging
- Key Suppliers
FMEA Examples & Ground Rules
It often is easy to analyze the failure modes and ensure that you are working the correct failure mode if you state it as a negative of the design function.
Select one of the following approaches to rate the failure mode or the cause of the failure mode. The scale must reflect:
- Occurrence: The historical quality of your products, or forecast for your new product based on analysis or tests.
- Occurrence Scale (1-10) with 1 being highly unlikely and 10 being almost certain.
- Severity: The nature of your products.
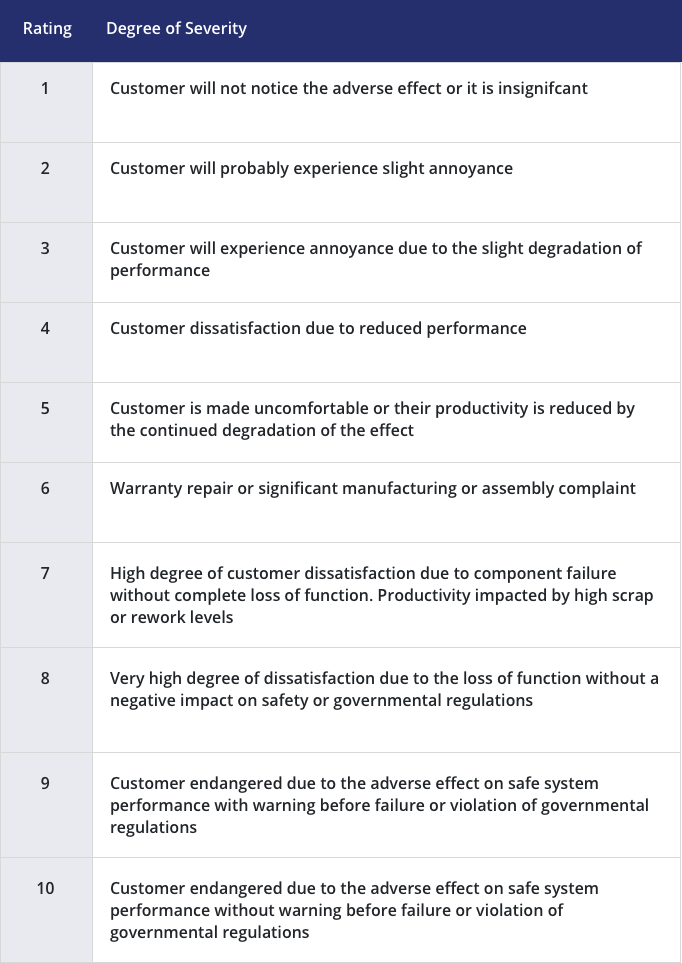
- Severity Scale (1 -10) with 1 being not noticed by a customer and 10 being hazardous or life-threatening and could place the product survival at risk.
- Detection: Your operating policies and standard operating procedures, or those procedures that have been proposed.
- Detection Scale (1-10) with 1 being almost certain to detect and 10 being almost impossible.
Note that you need to independently develop each column in the FMEA worksheet before proceeding to the next column.
Risk Priority Number
The information inputted into an FMEA is calculated, and the output is a Risk Priority Number (RPN). The RPN is calculated by multiplying the severity times the occurrence times the detection (RPN = Severity x Occurrence x Detection) of each recognized failure mode.
Note that by using only the RPN you can miss some important opportunities. In the following example, Failure Mode A is important because it is likely to escape to the customer. Failure Modes B and C, are critical because they could be costly.
Failure Modes | Severity (1-10) | Occurrence (1-10) | Detection (1-10) | RPN |
A | 2 | 4 | 10 | 80 |
B | 3 | 8 | 2 | 48 |
C | 9 | 2 | 1 | 18 |
FMEA Matrix Chart
An area chart focuses on the coordinates of Severity and Occurrence only, omitting Detection, in order to identify other opportunities with high costs.
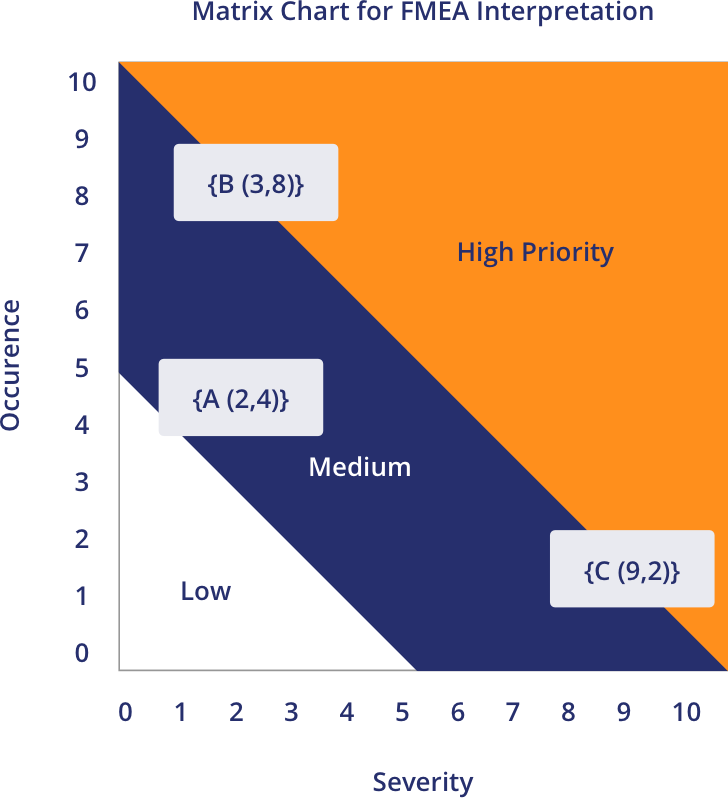
Just plotting the proactive variables of Severity and Occurrence and eliminating the reactive variable (Detection) can lead to different priorities. From a design viewpoint, this may make more sense but…BE CAREFUL!!!
For example, the potential failure for successful electronic transmission of a prepared tax return to the IRS would have a high Severity rating (due to an unfiled return), but if the filing system automatically checks for successful transmission then the Detection score is low. Ignoring the excellent detectability and pursuing designs to reduce the occurrence may be an unproductive use of team resources.
Similarly, the potential occurrence for failure via incorrect entry of a credit card number during an online purchase is fairly high, and the severity of proceeding with an incorrect number also is high. However, credit card numbers automatically are validated by a checksum algorithm (specifically, the Luhn algorithm) that detects any single-digit error, and most transpositions of adjacent digits. While not 100% foolproof, it is sufficiently effective that improvement of credit card number entry is a relatively low priority.
The FMEA Form
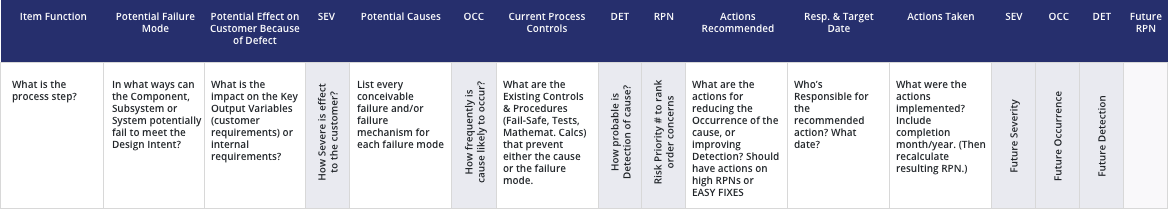
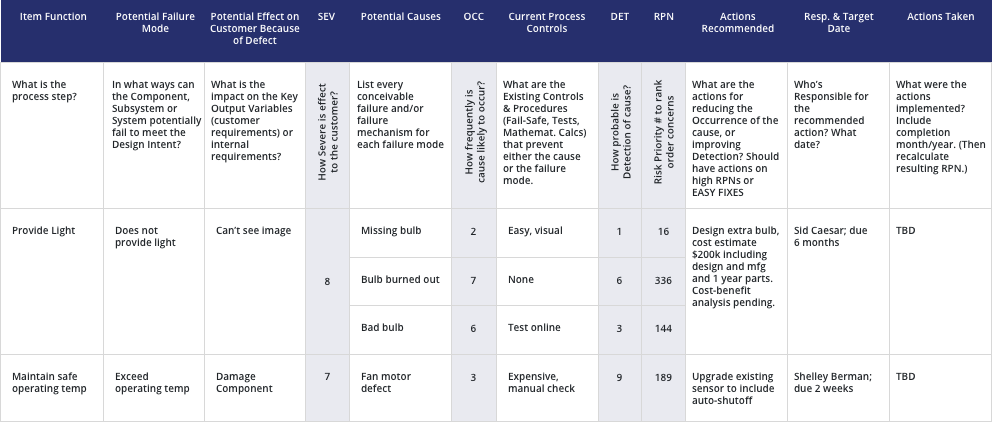
The following is an example of a form partially completed for two functions in a high-definition mobile computer projector. Note that there can be only one or several potential effects of a failure mode. Also, each separate potential cause of failure should be separated with separate RPN numbers.
How to Construct a FMEA: FMEA Procedure
Step 1: Provide background information on the FMEA:
- Identify a name or item name for the FMEA
- Identify the team participating in development of the FMEA
- Record when the FMEA was first created and subsequent revisions
- Identify and record the owner or preparer of the FMEA
Step 2: List the process steps, variable or key inputs.
Step 3: Identify potential failure modes.
- A failure mode is defined as the manner in which a component, subsystem, process, etc. could potentially fail. Failure modes can be identified through existing data, or by brainstorming possible instances when the process, product, or service may fail.
Step 4: Describe the potential effect(s) of failure modes.
Answer the question—if the failure occurs what are the consequences? Examples of failures include:
- Incorrect data
- Inoperability or stalling of the process
- Poor service
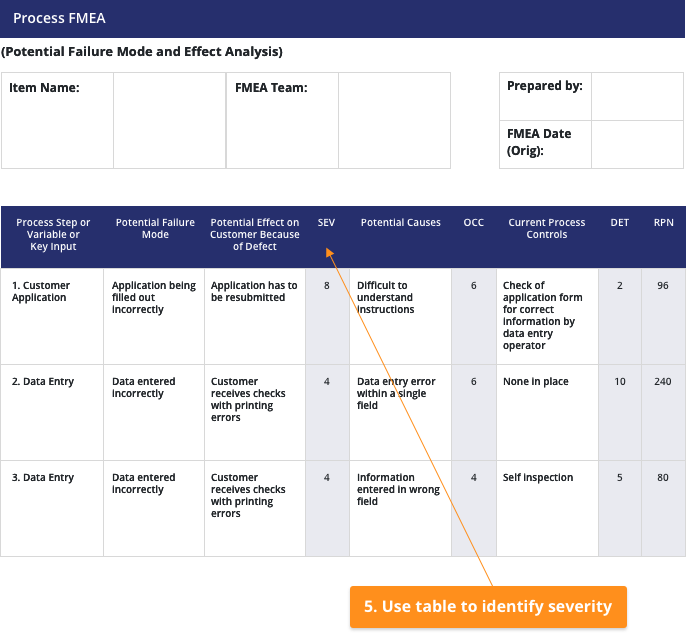
Step 5: Identify the severity of the failure using the following table.
Since this rating is based on the team’s perception, it can also be arbitrary unless backed up with data.
FMEA Severity Rating Factors
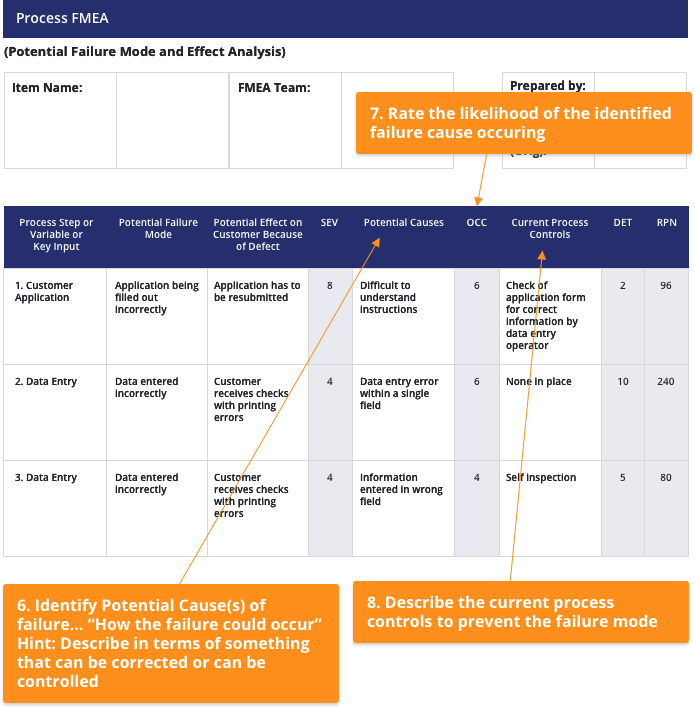
Step 6: Identify potential cause(s) of failure.
Describe the causes in terms of something that can be corrected or can be controlled.
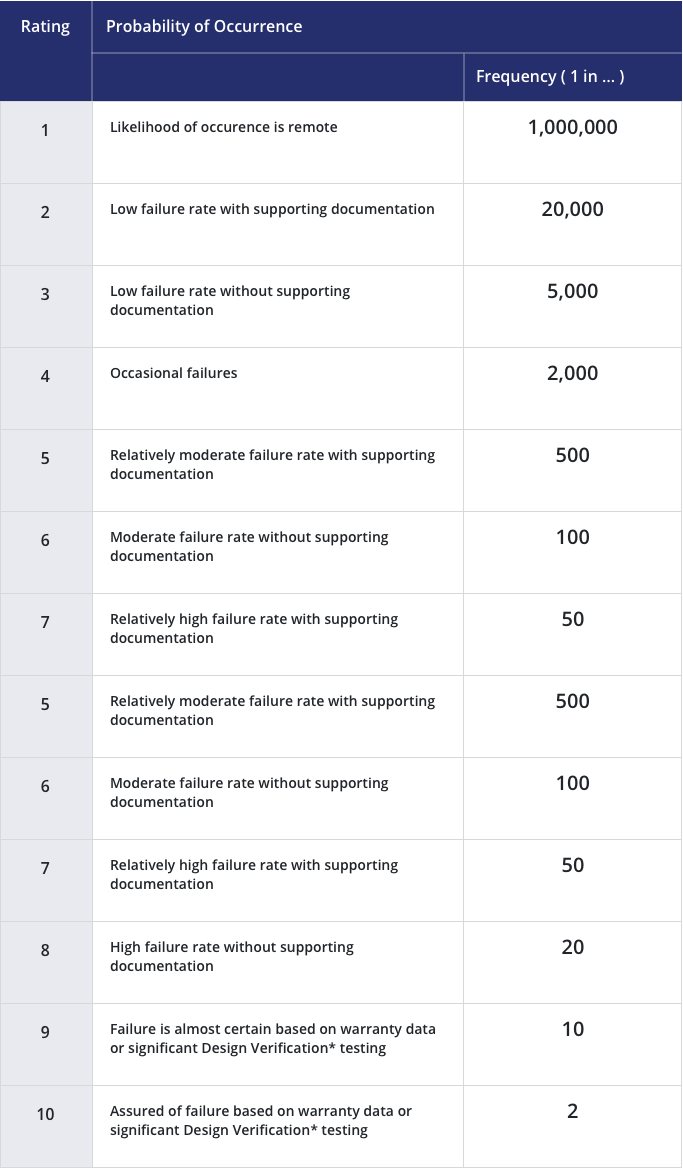
Step 7: Rate the likelihood of the identified failure cause occurring.
Use the following table to determine ranking.
FMEA Probability Rating Factors
Step 8: Describe the current process controls to prevent the failure mode—controls that either prevent the failure mode from occurring or detect the failure mode, should it occur.
- First Line of Defense—Avoid or Eliminate Failure Cause(s)
- Second Line of Defense—Identify or Detect Failure Earlier
- Third Line of Defense—Reduce Impacts/Consequences of Failure
*Design Verification Testing (DVT) is a test conducted when designing new products or services to verify that the optimal process design performs at the level specified by customer requirements (CTQs). DVT is a methodical approach used to identify and resolve problems before finalizing the process for new products or services.
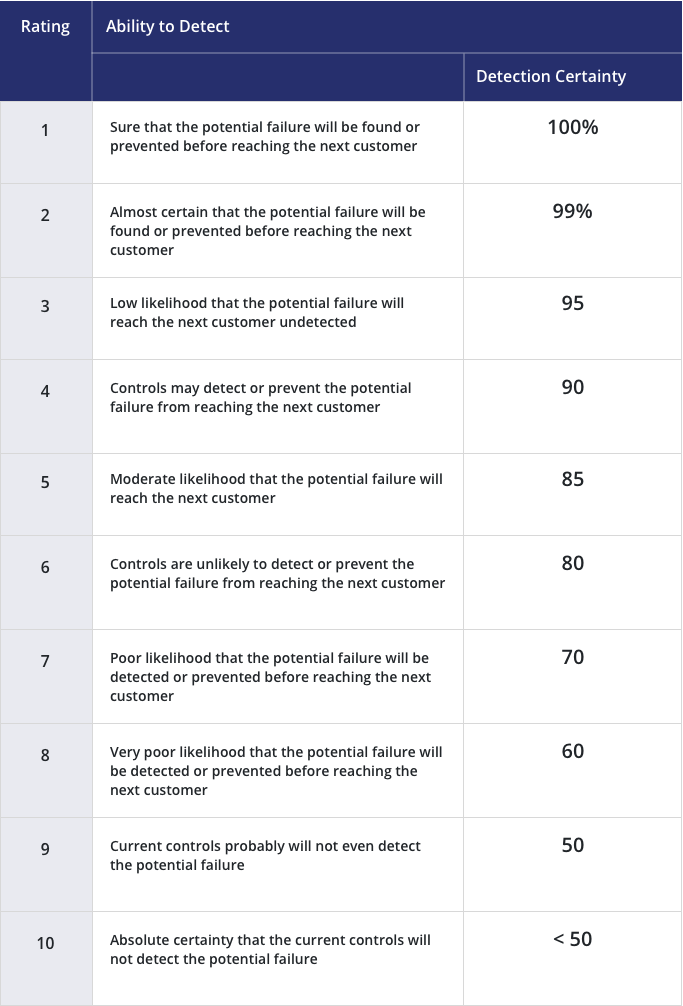
Step 9: Next, rank the likelihood that the failure cause will be detected. Use the following table.
FMEA Detection Rating Factors
Step 10: Multiply the three ratings to determine the Risk Priority Number (RPN) for each potential failure mode.
These numbers will provide the team with a better idea of how to prioritize future work addressing the failure modes and causes.
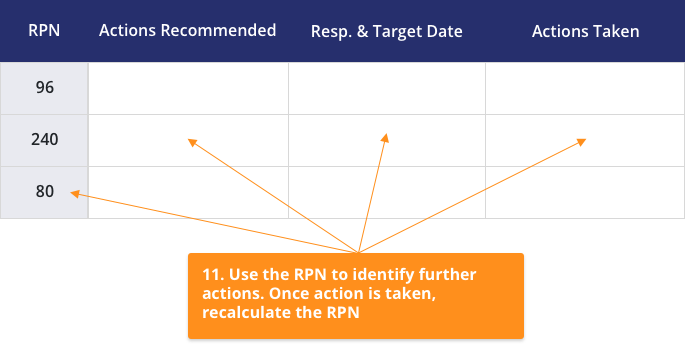
Step 11: Use the RPN to identify and prioritize further actions and who is responsible for completing those actions and by what date.
Document in the “actions taken” column only completed actions. As actions are completed there is another opportunity to recalculate the RPN and re-prioritize your next actions.
FMEA Action Planning
When is the FMEA Complete?
FMEA is a “living document” and should exist as long as the process, product, or service is being used. It should also be updated whenever a change is being considered. This includes keeping the “Actions Recommended,” “Responsibility and Target Date,” and “Actions Taken” columns up to date.
Pitfalls of FMEA
Using only the RPN to select where to focus the action might lead you to the wrong conclusion. How could this happen? How would you avoid the pitfall?
Example: Pitfalls
Failure Modes | Severity (1-10) | Occurrence (1-10) | Detection (1-10) | RPN |
A | 2 | 4 | 10 | 80 |
B | 3 | 8 | 2 | 48 |
C | 9 | 2 | 1 | 18 |
Failure C has by far the highest severity, but occurs only rarely and is invariably discovered before affecting the customer.
Failure B has minor impact each time it occurs, but it happens often, although it is almost always discovered before affecting the customer.
Failure A has even smaller impact and occurs less often than B. When the failure does occur, it almost always escapes detection.
The RPNs suggest that, as a result, failure mode A is the failure mode to work on first.
This choice might not be the best if you have not defined and assigned your ratings correctly. Because C has such a large effect when it does occur, be sure that both its frequency of occurrence and chance of detection are small enough to be the least important to work on now.
The result above would not be unusual, because the very large impact could have led to improvements in the past that reduced the defect rate and improved detection and control. The team needs to review the results and ask whether the individual interpretations and relative RPNs are consistent with their understanding of the process.
If the results do not seem to make sense, the team should review both the values assigned to each ranking and the rankings assigned to each failure mode, and change them if appropriate. However, FMEA analysis, by forcing systematic thinking about three different dimensions of risk, may, in fact, give the team new insights that do not conform with their prior understanding.
Failure Mode and Effect Analysis Template
Use this template to identify failure modes and calculate a Risk Priority Number.
To use the template:
- Download the Design and Process FMEA Template
- Identify and name the process, product or service. Identify who has responsibility and identify the team.
- List the item functions in column A.
- Identify possible failure modes in column B.
- Describe potential effect(s) of failure modes in column C.
- Use the provided table (in the Rating Factors Tab) to identify severity in column D.
- Identify potential causes of failure in column E. Describe these in terms of something that can be corrected or can be controlled.
- Rate the likelihood of the identified failure cause occurring in column F. Use the provided table in the Rating Factors Tab.
- Describe the current process controls to prevent the failure mode in column G.
- Use the provided table (in the Ratings Factors Tab) to determine the likelihood that that failure will be detected.
- The Risk Priority Number will be calculated automatically.
- Use the RPN to identify further actions in columns J, K, and L. Once an action is taken, recalculate the RPN.
Summary
As a tool, FMEA is one of the most effective low-risk techniques for predicting problems and identifying the most cost-effective solutions for preventing problems.
As a procedure, FMEA provides a structured approach for evaluating, tracking, and updating design/process developments. It provides a format to link and maintain many company documents.
As a diary, FMEA is started during the design/process/service conception and continued throughout the saleable life of the product. It is important to document and assess all changes that occur, which affect quality or reliability. When FMEA is done by a team, the payback is realized by identifying potential failures and reducing failure cost because of the collective expertise of the team who should understand the design/process.
FMEA is highly subjective and requires considerable guesswork on what may and could happen and the means to prevent this. If data is not available, the team may design an experiment or simply pool their knowledge of the process.
For more information on the failure mode and effect analysis and how Juran can help you leverage it to improve business quality and productivity, please get in touch with the team.
| Check out Juran’s LSS Training Courses |
| Lean Six Sigma Yellow Belt |
| Lean Six Sigma Green Belt |
| Lean Six Sigma Black Belt |
| Upgrade to Black Belt |
| Lean Six Sigma Master Black Belt |
| Lean Expert Program |