
Pareto diagrams are not hard to construct. With a calculator, graph paper, and a sharp pencil (or even better, a computer with spreadsheet and charting software), an improvement team can easily produce Pareto diagrams to help in decision making.
Getting Ready
As with all the analytical tools, a good Pareto diagram starts with good data. In this case, the data that is needed is any measure of quality, stratified by the various categories that contribute to the overall effect.
The measure of quality can be anything that the team agrees will quantify the negative impact of the issue under consideration. Typical measures include: Cost, time, number of errors or failures, percent of customers expressing an opinion, etc.
The measure (e.g., cost) must be the same for all contributors in the analysis. Pareto analysis is a measured and ranked comparison. You cannot rank by different measures on the same Pareto table or diagram; that would be “comparing apples to oranges.”
Make sure that you spend time identifying all of the potential contributors before you set out to gather the data. Otherwise, you may end up with “miscellaneous” or “unclassified” items. It does not help to focus your team’s efforts if one of the “vital few” is titled “miscellaneous.”
The list of contributors to the effect can come from a variety of sources: Group brainstorming sessions, cause-effect diagrams, process flow diagrams, or the data itself.
Sometimes, the data you need already exists in accounting systems, routine management reports, or the files of individuals in the organization. If, however, the data does not exist, your team should develop a means for gathering it.
No matter how you develop the raw data for your Pareto analysis, to be successful, your data must:
- Use facts, not opinions, as the basis for decision making.
- Use the same measure for all contributors, and use the same assumptions and calculations throughout. Keep in mind that Pareto analysis is a comparison technique. Also note that consistency is more important than absolute precision in the numbers. It does not matter so much if assumptions and cost estimates are, say, conservative throughout by ten percent; as long as they stay consistent across all categories, the comparisons will still yield the correct “vital few.”
- Make sure your data represents the actual conditions and situations in the process.
- Avoid controversial assumptions or techniques. Keep in mind that you are using Pareto analysis to support decision making. If people do not believe the data, they will not support your team’s decision.
- Be creative!
Steps to Construct a Pareto Diagram
The following example will display the steps to construct a Pareto Diagram.
A team wanted to reduce the number of billing problems. Customer service reps were asked to record the type of defects (or billing problems) for each customer call during a one-week study period. At the end of the week, the team collected the checksheets and tallied the results by specific cause. To build the Pareto, they followed these steps:
Step 1: Total the data on effect of each contributor, and sum these to determine the grand total.
Defect Type | # Queries |
Address Wrong | 8 |
Time Incorrect | 20 |
Rate Factor Incorrect | 4 |
Service Coding Wrong | 32 |
Format Confusing | 6 |
Payment Not Credited | 3 |
73 |
Step 2: Re-order the contributors from the largest to the smallest.
Defect Type | # Queries |
Service Code Wrong | 32 |
Time Incorrect | 20 |
Address Wrong | 8 |
Format Confusing | 6 |
Rate Factor Incorrect | 4 |
Payment Not Credited | 3 |
73 |
Step 3: Determine the cumulative-percent of total.
For example, the cumulative-percent of total through the fifth contributor is the sum of the effects of the first five in rank ordering, divided by the grand total, and multiplied by 100.
[(32+20+8+6+4)/73]x100=(70/73)x100=96%
The resulting table is called the Pareto Table.
Defect Type | # Queries | Cumulative % |
Service Code Wrong | 32 | 44% |
Time Incorrect | 20 | 71% |
Address Wrong | 8 | 82% |
Format Confusing | 6 | 90% |
Rate Factor Incorrect | 4 | 96% |
Payment Not Credited | 3 | 100% |
73 |
Step 4: Draw and label the left vertical axis.
- Label the axis from zero to the grand total or just beyond.
- Provide a caption to describe the measure being used.
Step 5: Draw and label the horizontal axis.
- Divide the axis into as many divisions as there are contributors.
- List the contributors from largest to smallest, going from left to right.
- Provide a caption to describe them.
- If the contributor names are long, label the axis A, B, C, etc. and provide a separate key.
Step 6: Draw and label the right vertical axis.
- Label the axis from zero to 100 percent.
- Line up 100 percent with the grand total on the left axis. In this example, the grand total is 73, so the 50 percent point on the right axis should line up with 36.5 on the left axis.
- (50/100)x73=36.5
- Provide the caption: “Cumulative-Percent of Total.”
Step 7: Draw bars to represent the magnitude of each contributor’s effect.
The height of the bars corresponds to the magnitude of that contribution as measured on the left axis.
Step 8: Draw a line graph to represent the cumulative-percent of total.
- The plotted points correspond to the cumulative-percent as measured on the right axis.
- Line up the points above the right-hand edge of the bars.
- The cumulative-percent-of-total point for the first ranked contributor should be even with the height of the first bar. If not, you have made an error.
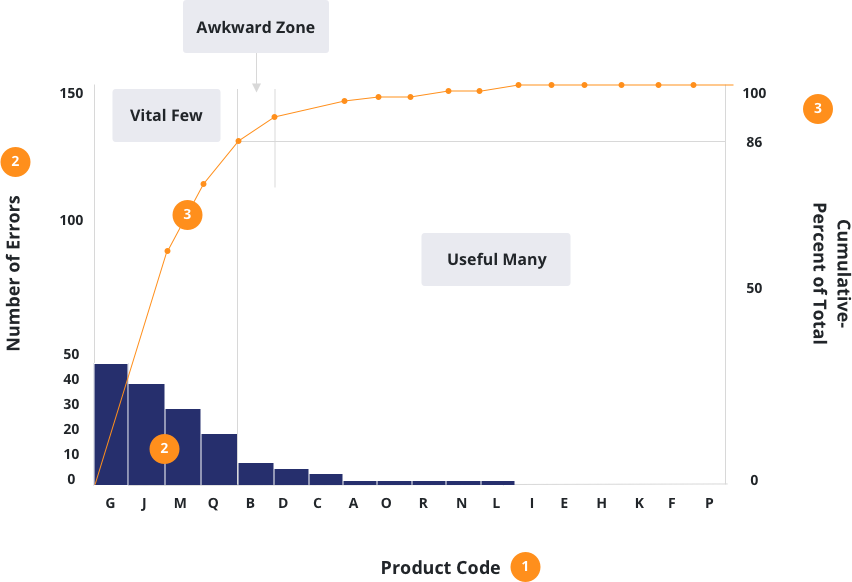
Step 9: Analyze the diagram.
Look for a breakpoint on the cumulative-percent graph.
Step 10: Title the chart, label the “vital few” and “useful many”, and show the cumulative-percent contribution of the vital few.
Read our guide on the Pareto Principle and Pareto Analysis for more information on these key quality improvement concepts.
For more information on Pareto Diagrams and how Juran can help you leverage them to improve business quality and productivity, please get in touch with the team.
| Check out Juran’s LSS Training Courses |
| Lean Six Sigma Yellow Belt |
| Lean Six Sigma Green Belt |
| Lean Six Sigma Black Belt |
| Upgrade to Black Belt |
| Lean Six Sigma Master Black Belt |
| Lean Expert Program |