
What is Statistical Process Control?
The control process detects and takes action on sporadic quality problems; the improvement process identifies and takes action on chronic quality problems.
In the control process, statistical control charts detect the existence of special causes of variation that result in sporadic problems. The charts show sample data falling beyond statistical control limits, i.e., the process is “out of statistical control.”
Conversely, when a chart shows that a process is “in statistical control,” the process is in a state of stability, and variation is due to a set of common causes inherent in the process. Statistical control means stability, but stability does not always mean customer satisfaction with the result.
Unfortunately, a process in statistical control can have serious quality problems. Because the process is stable, the problems will continue (become chronic) unless a basic change in the system of common causes is made. Such a change, which typically affects the average or variation, is the job of improvement. “Removal of a special cause of variation, to move toward statistical control, important though it may be, is not improvement of the process” (Deming, 1986, page 338).
Process improvement is directed at several problems:
- The process average is misdirected. Table 20.9 shows possible corrective action.
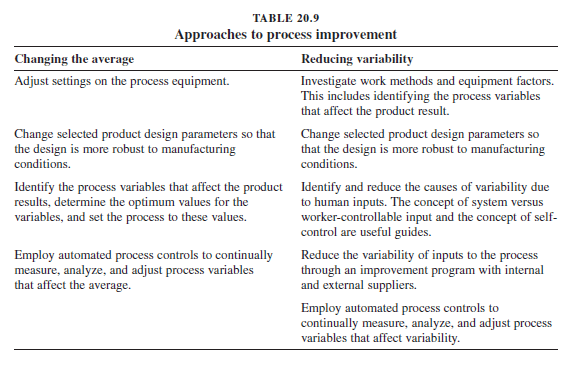
- The inherent variability of the process is too large. Table 20.9 provides some of the approaches available to reduce variability.
- The instrumentation is inadequate. See Section 15.8, “Errors of Measurement.”
- A process drift exists. Here the need is to quantify the amount of drift in a given period of time and to provide a means of resetting the process to compensate for this drift.
- Cyclical changes in the process exist. The need is to identify the underlying cause and either remove it or reduce the effect on the process.
- The process is erratic. Sudden changes can take place in processes. As the capability studies quantify the size of these changes and help to discover the reasons for them, appropriate planning action can be taken:
- Temporary phenomena (e.g., a cold machine coming up to operating temperature) can be dealt with by scheduling warming periods plus checks at the predicted time of stability.
- More enduring phenomena (e.g., changes due to new materials) can be dealt with by specifying setup reverification when such changes are introduced.
The statistical design of experiments is an essential analytical tool for improvement that goes far beyond the investigation of out-of-control points on a statistical control chart. This tool, when combined with the knowledge of those who plan and run the processes, replaces intuitive decision making with a scientific basis.
Now, how do these matters relate to customer needs?
Clearly, in using statistical process control and taking subsequent actions, the focus must be on meeting customer needs. One definition—which is far from perfect—is given by specification limits. Limits on statistical control charts are different from specification limits. In some situations, a process is not in statistical control but may not require action because the product specifications are easily met. In other situations, a process is in statistical control, but the product specifications are not being met.
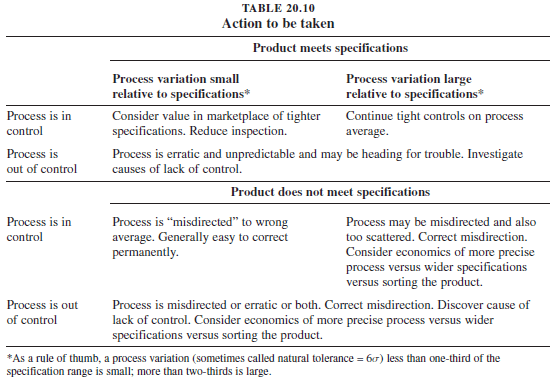
If a product does not meet specifications, then some type of action is needed—changing the average value, reducing the variability, doing both, changing the specifications, sorting the product, etc. If a product does meet the specifications, the alternatives are different—taking no action, using a less precise process, or reducing the variability further (see below for reasons). Table 20.10 shows the more usual permutations encountered and provides suggestions on the type of action to be taken.
Our goal for processes is clear: Be in statistical control and be capable of meeting product specifications. Note that this chapter focuses on the variability of product characteristics and its relationship to specification limits. A broader issue of improvement is the ability of existing product features to meet customer needs.
For more information on statistical process control and how Juran can use it to improve your productivity, please get in touch with the team.
| Check out Juran’s LSS Training Courses |
| Lean Six Sigma Yellow Belt |
| Lean Six Sigma Green Belt |
| Lean Six Sigma Black Belt |
| Upgrade to Black Belt |
| Lean Six Sigma Master Black Belt |
| Lean Expert Program |